Key Takeaway
- Most companies collect data, but few actually decide with it. Building a real framework is what closes that gap.
- Data-driven decision-making is linked to measurably better business outcomes, including higher customer acquisition, retention, and profitability.
- A workable framework has six parts: clear objectives, prioritized data sources, clean data, analysis, visualization, and a culture that actually uses the output.
- Poor data quality, data silos, and weak data literacy are the three biggest blockers, and each has a practical fix.
- AI and automation are shifting decision-making from dashboards you read to systems that recommend and increasingly take the next action.
Every company claims to prioritize data-driven decision-making, but collecting data is not the same as using it to make better choices. Data-driven decision-making means using reliable data, analysis, and measurable insights to guide business decisions instead of relying primarily on assumptions or intuition.
According to Forbes Councils, citing MIT Sloan Management Review research, only about 1/3rd of organizations describe themselves as genuinely data-driven, even though nearly all of them are investing heavily in data and AI. That gap between spending on data and actually deciding with it is the real story of 2026.
This guide breaks down what that gap looks like in practice, why it matters right now, and how to build a framework your team will use instead of ignoring. You will find real examples, a step-by-step process, the technology stack behind it, and the numbers that show what is at stake when businesses get this wrong.
What Is Data-Driven Decision Making?
This means using verified data, not gut feeling, as the primary basis for business choices. It replaces “we think” with “we know,” backed by numbers you can trace back to a source. That does not mean ignoring experience or judgment. It means using data to test assumptions before you commit budget, headcount, or strategy to them.
The distinction matters because intuition and data are not opposites. The best decisions usually combine both. However, research consistently shows that when data is available and ignored in favor of gut feeling, the resulting decisions perform worse and get reversed more often.
Data-Driven vs. Intuition-Led Decision Making
| Factor | Intuition-Led Approach | Data-Driven Approach |
| Basis for the decision | Past experience, instinct, opinion | Verified data, tested assumptions |
| Speed to first decision | Often faster upfront | Slightly slower upfront, faster to scale |
| Reversal rate | Higher, especially under pressure | Lower, because the reasoning is traceable |
| Accountability | Hard to audit after the fact | Easy to review and improve next time |
| Scalability across teams | Depends on who made the call | Repeatable as a framework anyone can follow |
Why This Matters in 2026
Three forces are pushing this from “nice to have” to mandatory this year. First, the sheer volume of available data has exploded, so businesses that cannot process it are sitting on an asset they never use. Second, AI has made real-time analysis and forecasting accessible to companies that could never have afforded a dedicated data science team. Third, competitors that already made the shift are pulling ahead fast enough that catching up gets harder every quarter.
None of this works without a strategy behind it. As we have discussed in Your Competitors Are Already Building, Are You? Businesses need to act on emerging technologies rather than simply observe how the market changes. For data-driven organizations, that means turning scattered information into clear insights and using those insights to make faster, more informed decisions.
Key Business Benefits of Data-Driven Decision Making
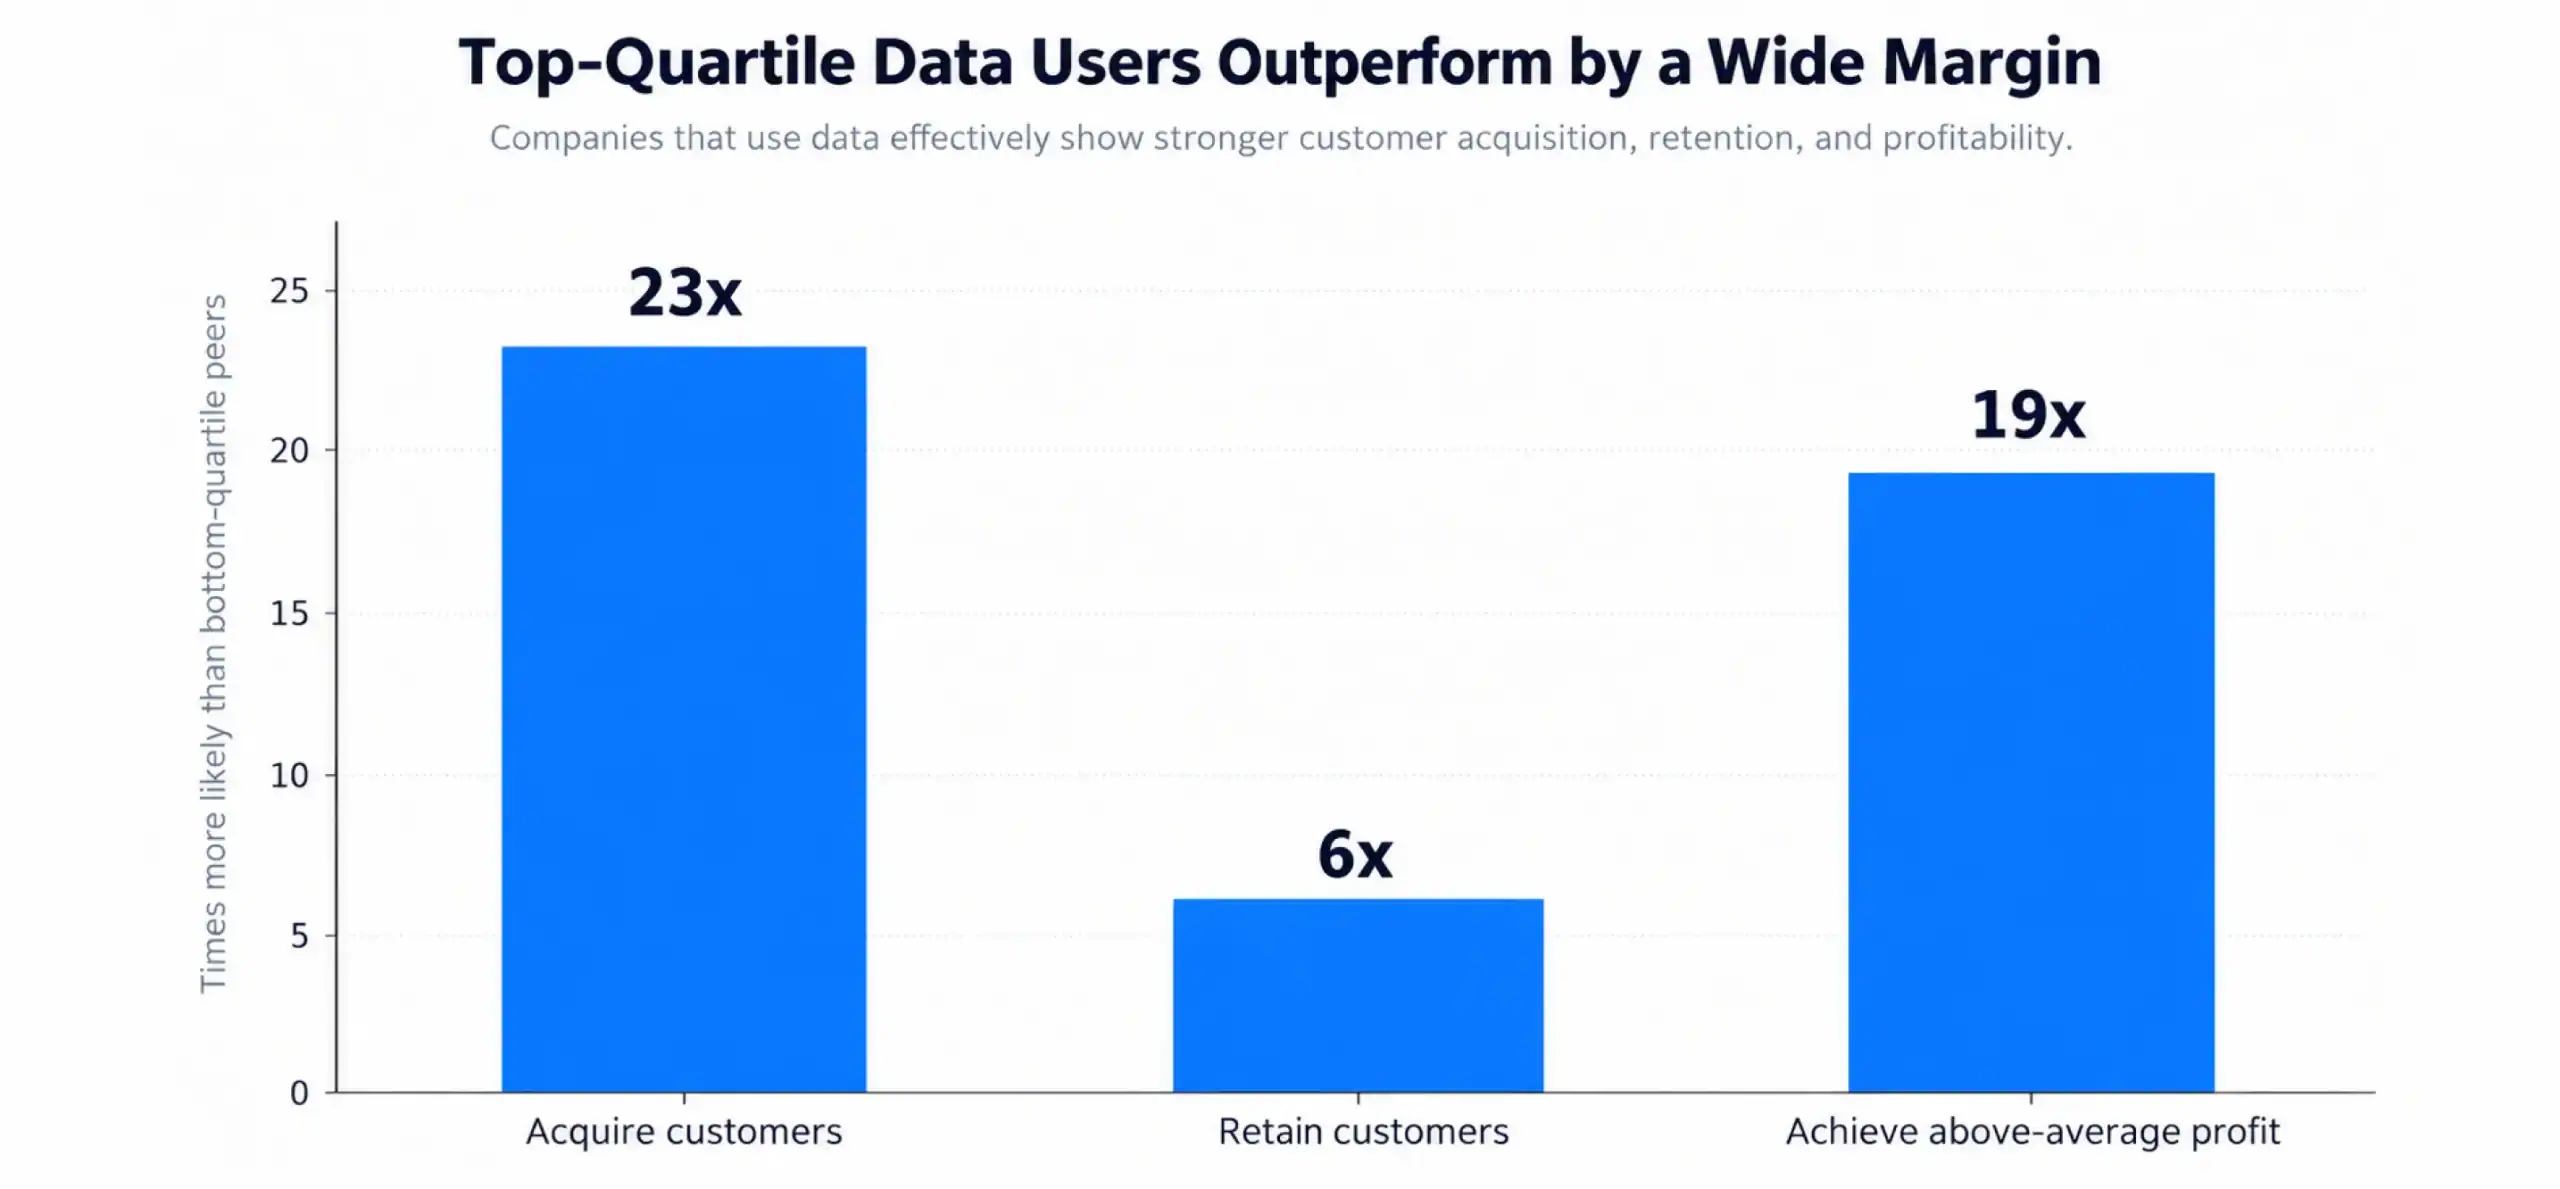
The case for data-driven decision-making is not theoretical. McKinsey’s analysis of top-performing companies found that organizations in the top quartile for data use in decisions are 23 times more likely to acquire customers than bottom-quartile peers, 6 times more likely to retain them, and 19 times more likely to be profitable above average.
1. Improve Operational Efficiency
When you can see exactly where time and money leak out of a process, you can fix it instead of guessing. Real-time dashboards surface bottlenecks in production, fulfillment, or support before they become expensive problems, so teams spend less time firefighting and more time improving.
2. Understand Customers Better
Behavioral data, purchase history, and support interactions reveal what customers actually do, not just what they say in a survey. That level of data insights lets you segment audiences accurately and personalize offers instead of guessing at what might resonate.
3. Improve Marketing and Sales Performance
Attribution data shows which channels and messages actually drive revenue, not just clicks. Sales teams that work from accurate, current pipeline data close more deals because they prioritize the leads most likely to convert instead of spreading effort evenly.
4. Improve Forecasting and Planning
Predictive analytics models turn historical patterns into demand forecasts, staffing plans, and budget projections. Instead of planning around last year’s numbers, teams plan around where the trend is actually headed.
5. Drive Product and Service Innovation
Usage data reveals which features customers rely on and which ones sit unused. That feedback loop shortens the distance between an idea and a validated product decision, so teams spend development time on what actually moves the needle.
Real-World Examples of Data-Driven Decisions
These principles play out differently across industries, but the pattern is consistent: better visibility leads to faster, more accurate calls.
Retail: Optimizing Inventory and Preventing Stockouts
Retailers use point-of-sale data, seasonal trends, and supplier lead times together to set reorder points automatically. Instead of reacting to an empty shelf, the system flags the risk of a stockout days in advance, so buyers can act before a sale is lost.
SaaS: Reducing Churn with Behavioral Analytics
Subscription businesses track login frequency, feature adoption, and support ticket volume to build churn-risk scores. When an account’s usage pattern starts to match past churners, customer success teams get an alert and can step in while the relationship is still recoverable.
Manufacturing: Improving OEE Using Real-Time Sensor Data
IoT sensors on production equipment feed data on uptime, speed, and quality directly into overall equipment effectiveness (OEE) dashboards. Plant managers see exactly where a line is losing throughput, whether that is unplanned downtime, slow cycles, or defects, and can fix the root cause instead of the symptom.
Public Sector: Traffic Safety and Disaster Response
City agencies combine traffic sensor data, weather feeds, and historical incident records to identify high-risk intersections and pre-position emergency resources ahead of severe weather. That shift from reactive to predictive planning saves both money and, in some cases, lives.
How to Build a Framework for Data-Driven Decisions
A data-driven decision-making framework is what turns good intentions into a habit your organization actually follows. Skip any one of these six steps and the whole system tends to collapse back into guesswork.
The Six-Step Framework at a Glance
| Step | What It Involves | Outcome |
| 1. Identify business objectives | Define the specific decision or metric you are trying to improve | A clear target instead of open-ended data exploration |
| 2. Locate and prioritize data sources | Map internal systems, third-party feeds, and gaps | Know exactly what data exists and what is missing |
| 3. Collect and prepare the data | Data collection, cleaning, and standardization across every source | Trustworthy inputs for analysis |
| 4. Analyze and interpret the information | Apply statistical methods and models to find patterns | Insight tied directly to the original objective |
| 5. Visualize and share findings | Build dashboards and reports stakeholders can actually read | Faster, shared understanding across teams |
| 6. Foster a data-driven culture | Train teams, set expectations, reward evidence-based calls | The framework survives beyond one project |
The Decision-Making Process, Step by Step
This data-driven decision-making process is the operational sequence you run every time a real decision is on the table. Where the framework above sets up your capability, this process is what you actually do, decision by decision.
- Define the business problem. Write down the exact question you are trying to answer. A vague goal produces a vague analysis.
- Collect relevant data. Pull only the data tied to that question from the systems that generate it.
- Clean and organize the data. Remove duplicates, fix formatting issues, and reconcile conflicting records before analysis starts.
- Analyze the data. Apply the right method, whether that is a simple trend line or a full statistical analysis model, to the specific question.
- Turn insights into decisions. Translate the analysis into two or three concrete options, with the tradeoffs stated plainly.
- Implement and measure results. Roll out the decision and track the same metric you started with, so you can tell if it worked.
- Refine future decisions. Feed what you learned back into the next cycle, so each decision gets sharper than the last.
Core Technologies Powering Data Decisions
None of the processes above works at scale without the right technology and business analytics platforms underneath it. Here is what actually does the work.
1. Artificial Intelligence (AI) and Machine Learning (ML)
AI and ML models find patterns in volumes of data no human team could review manually. They power everything from fraud detection to demand forecasting, and increasingly generate AI-driven insights without a human having to write the query first.
2. Real-Time Data Analytics
Streaming analytics platforms process data as it is generated instead of in nightly batches. That matters most when a delayed decision is a lost one, such as adjusting inventory or flagging a security anomaly.
3. Predictive and Prescriptive Modeling
Predictive models forecast what is likely to happen next. Prescriptive models go a step further and recommend what to do about it, closing the gap between insight and action.
4. Enterprise Integration Platforms
Data integration tools connect CRM, ERP, and other core systems, allowing information to move between applications instead of remaining in separate silos. This can improve data consistency, reduce duplicate work, and give teams a more connected view of business operations. For a deeper look at how these systems connect, see our guide to enterprise application integration.
5. Data Visualization Software
Dashboards and reporting tools turn raw numbers into something a non-technical stakeholder can actually act on. Good visualization is what makes business intelligence (BI) useful day to day, not just something the analytics team looks at.
How to Measure the Impact of Data-Driven Decisions
A framework only proves its worth if you can measure what changed after you adopted it. Track these four categories.
KPI Categories for Measuring the Impact
| KPI Category | Example Metrics |
| Operational KPIs | Cycle time, error rate, throughput, downtime |
| Customer KPIs | Retention rate, churn rate, customer lifetime value, NPS |
| Financial KPIs | Revenue per decision, cost savings, ROI on data initiatives |
| Decision-Making KPIs | Time to decision, decision reversal rate, forecast accuracy |
Decision-making KPIs are the most overlooked category, and they are the most direct signal of whether the framework itself is working. If decisions are still slow or getting reversed often, the problem is usually upstream in data quality or culture, not in the decision itself.
Common Challenges of Data-Driven Decision Making
Every company hits some version of these six problems. The good news is that each one has a known fix.
Common Challenges and How to Address Them
| Challenge | Practical Fix |
| Poor data quality | Set data quality standards and assign clear ownership per data set |
| Data silos and integration problems | Invest in integration platforms that connect core systems |
| Lack of data skills | Build role-based, hands-on training instead of one-off workshops |
| Data privacy and security risks | Apply governance frameworks and access controls from day one |
| Bias in data and algorithms | Audit training data and model outputs for skewed representation |
| Difficulty turning insights into action | Assign an owner to every insight with a required next step |
1. Poor Data Quality
Bad data is expensive. Gartner estimates that poor data quality costs organizations an average of $12.9 million every year. Separately, Forrester’s Data Culture and Literacy Survey found that more than a quarter of data and analytics professionals estimate their organization loses over $5 million annually to poor data quality, with 7% reporting losses of $25 million or more. Data governance is what prevents these numbers from compounding year over year.
2. Data Silos and Integration Problems
When sales, marketing, and finance each keep their own version of the truth, no single report can be trusted. Fixing this is rarely a technology problem first. It is a governance problem that integration tools then make possible to solve at scale.
3. Lack of Data Skills
A 2026 DataCamp and YouGov survey found that 60% of enterprise leaders report a data literacy skills gap, even though most already offer some form of data training. Leaders tied that gap directly to business risk: 35% cited inaccurate decision-making, and 32% cited slower decision-making as the top consequences.
4. Data Privacy and Security Risks
The more data you centralize to make better decisions, the more valuable a target it becomes. Strong access controls, encryption, and clear data retention policies need to scale alongside your analytics capability, not trail behind it.
5. Bias in Data and Algorithms
A model trained on skewed historical data will confidently produce skewed recommendations. Bias reduction requires deliberately auditing both the training data and the model’s outputs, especially in decisions that affect hiring, lending, or pricing.
6. Difficulty Turning Insights Into Action
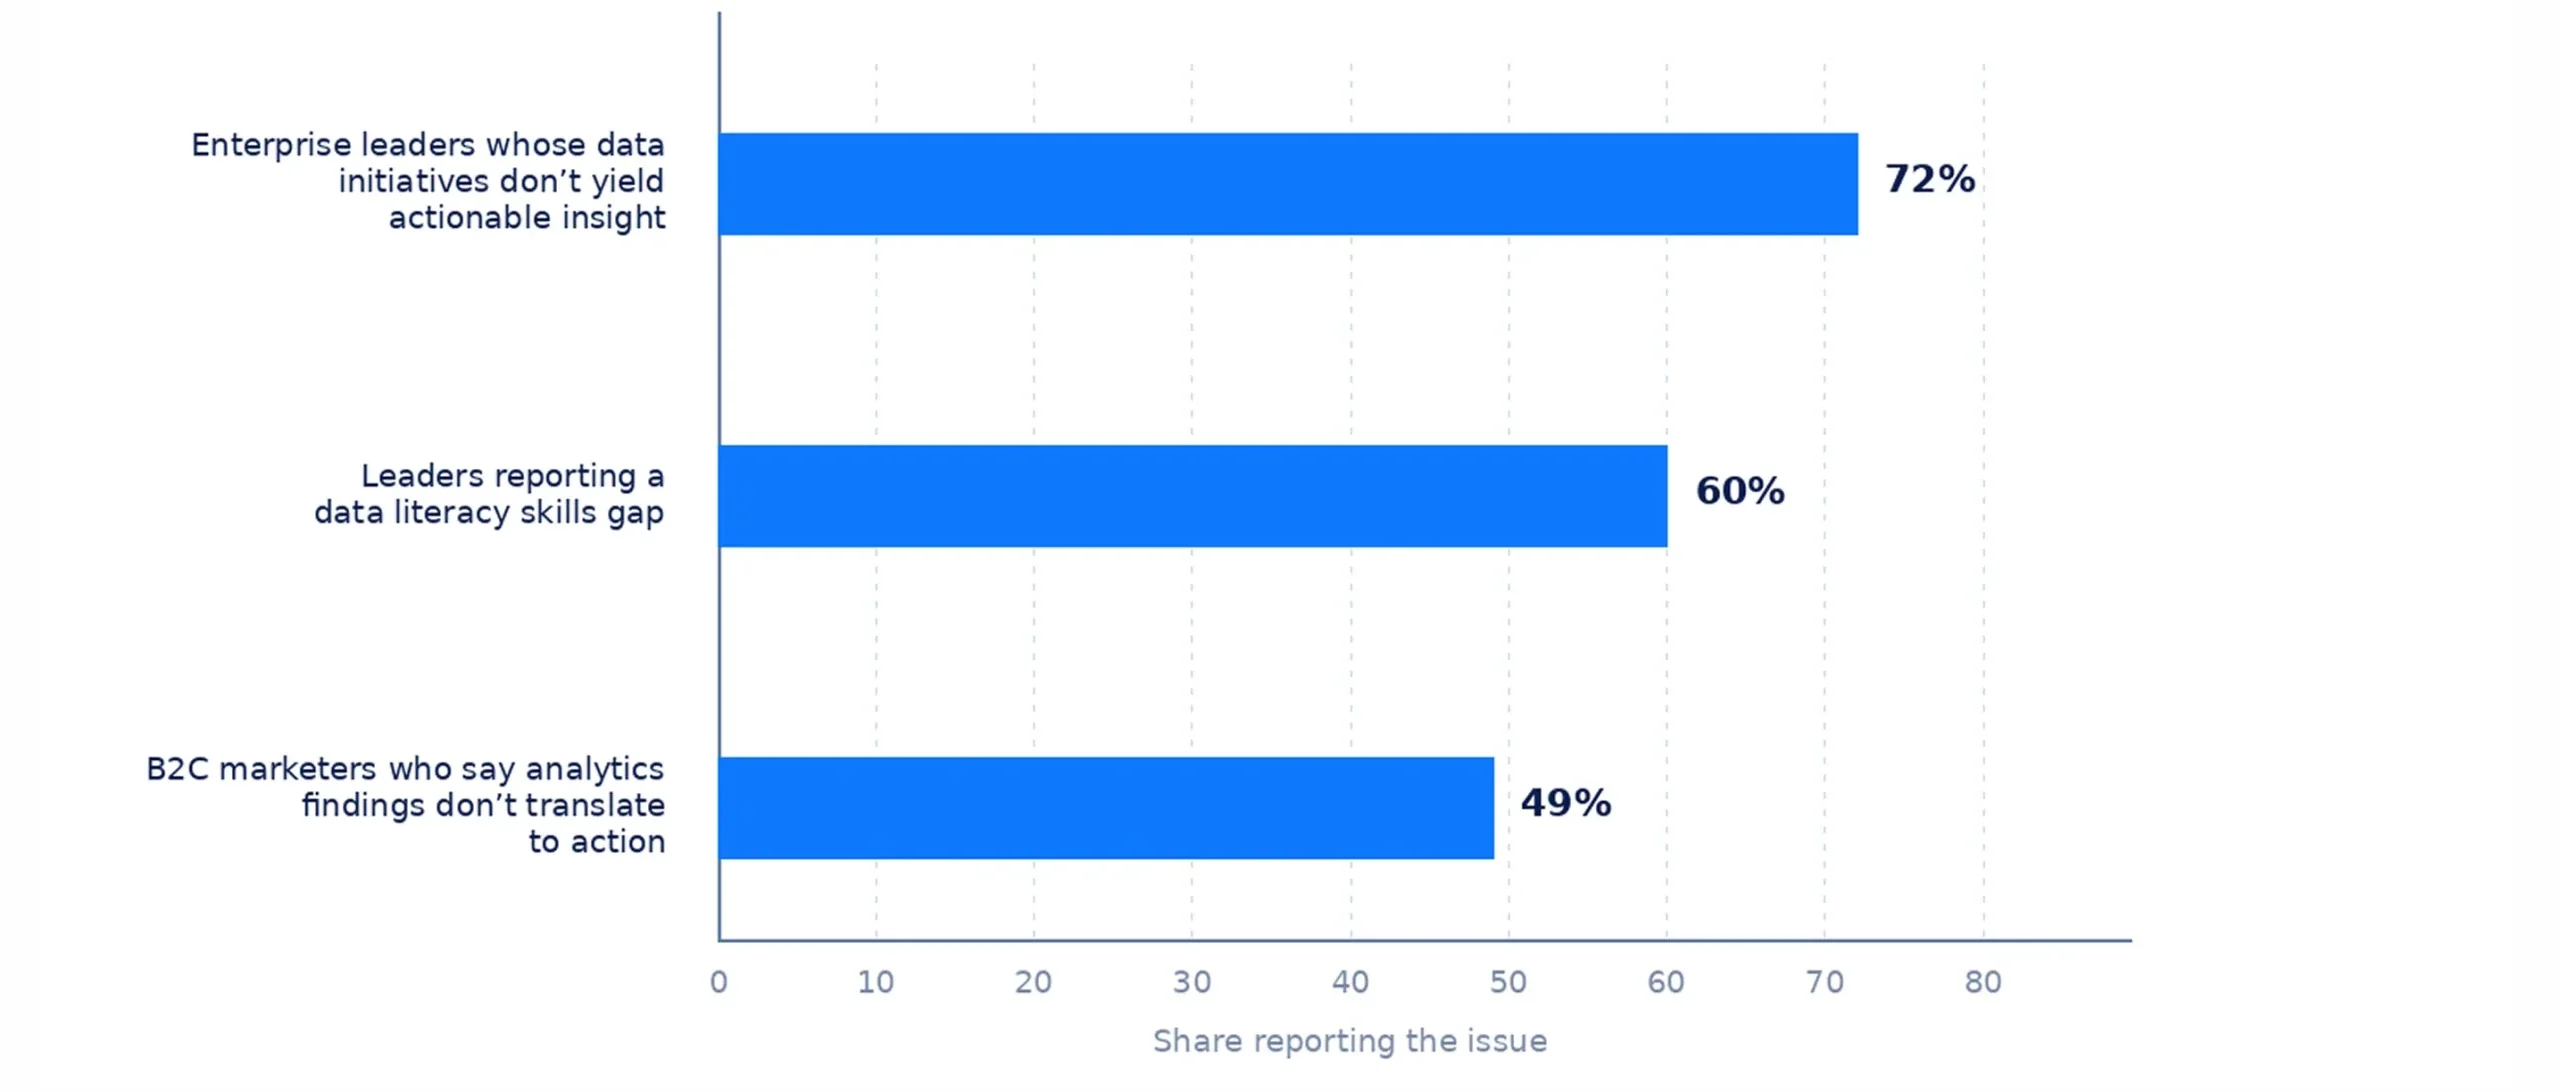
This is where most data initiatives quietly fail. Industry research finds that 72% of enterprise leaders say their data initiatives do not deliver actionable insights, often because of fragmented systems and unclear objectives. Forrester’s 2026 marketing surveys found a similar pattern closer to the ground: 49% of B2C marketing decision-makers still say analytics findings do not translate into action.
Future Trends Shaping How Businesses Decide
AI Agents and Autonomous Decision Loops
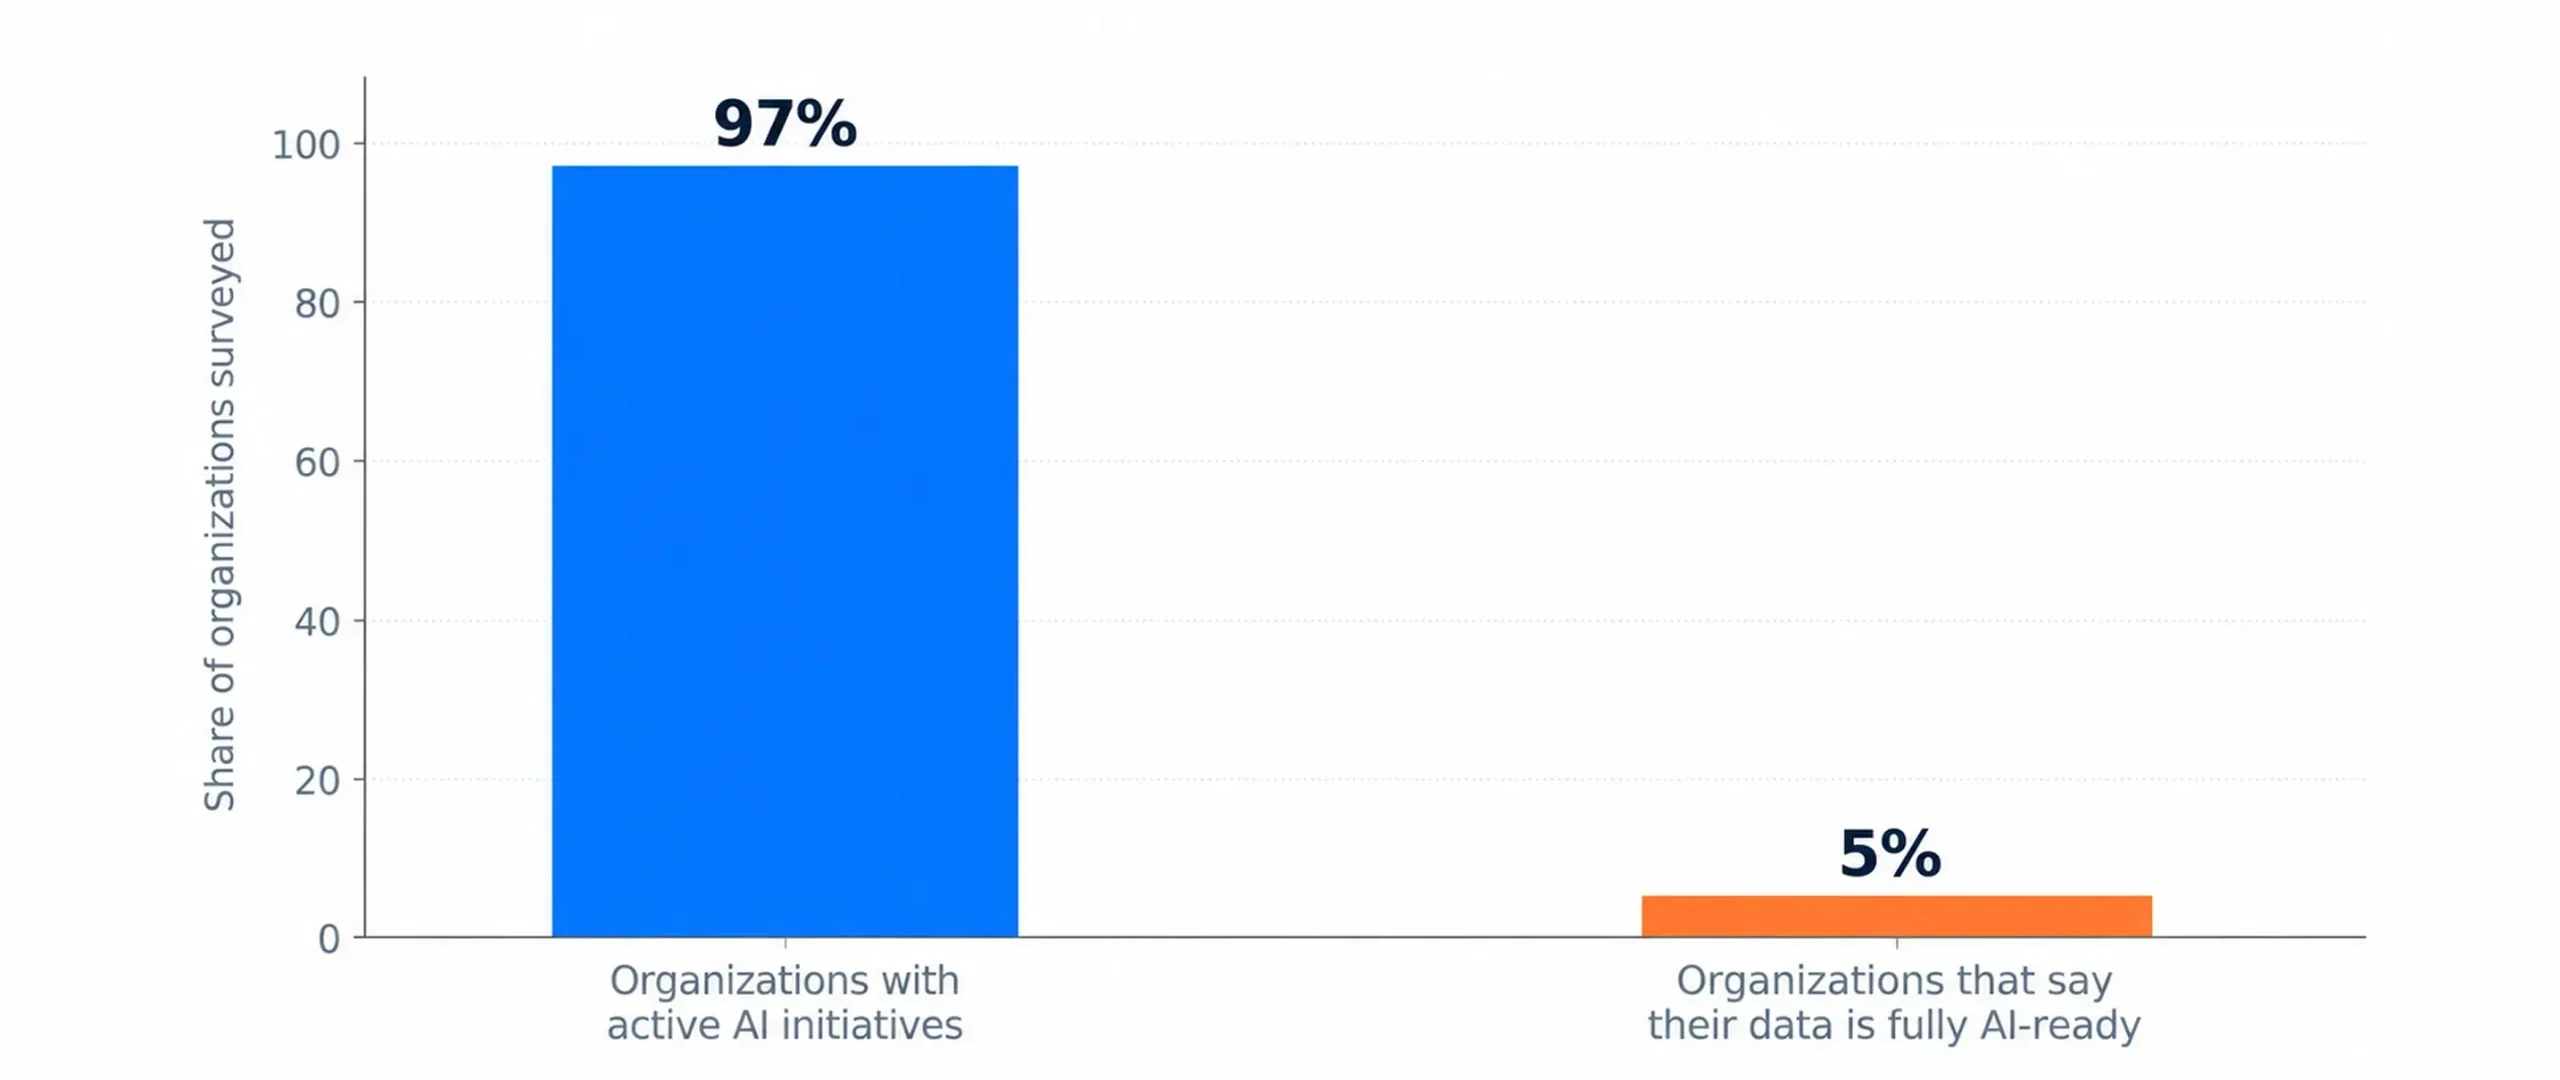
Adoption is way ahead of readiness. Dun & Bradstreet’s global survey of 10,000 businesses found that 97% of organizations now report active AI initiatives, but only 5% say their data is fully ready to support them. Closing that gap, not adding more AI tools, is the real work ahead for most teams.
Real-Time and Edge Analytics at Scale
Processing data closer to where it is generated, rather than shipping everything to a central cloud first, cuts the delay between an event and a decision. Expect this to keep expanding beyond manufacturing and logistics into retail and healthcare.
Privacy-Enhancing Technologies and Synthetic Data
As regulation tightens, more organizations are training and testing models on synthetic data that mirrors real patterns without exposing real customer records. This lets teams keep innovating without taking on unnecessary privacy risks.
From Dashboards to Decision Automation
Decision automation is the next step beyond dashboards you read and act on manually. Increasingly, systems will flag the decision, recommend the action, and in lower-risk cases, execute it directly, with humans reviewing exceptions rather than every case.
How Cubix Helps Businesses Make Data-Driven Decisions
Cubix works with businesses to close the gap between collecting data and actually using it to make better decisions. Our Business Intelligence Services turn raw data into dashboards and actionable insights that teams can use to guide everyday decisions.
For companies weighing whether a data initiative is worth the investment, the guide on the ROI of custom software development explains how to build a data-backed business case and evaluate potential returns.
With over 18 years of experience across big data, AI, and enterprise integration, Cubix also provides Artificial Intelligence Development Services to help organizations build predictive and prescriptive models into their workflows. This helps businesses move beyond scattered spreadsheets and disconnected systems toward a more structured approach to data-driven decision-making
Frequently Asked Questions
1. What exactly is data-driven decision making?
It is the practice of basing business decisions on verified data and analysis rather than intuition alone. It does not remove human judgment, it gives that judgment better evidence to work from.
2. Why is DDDM so important for competitive advantage?
Because the performance gap is measurable. McKinsey research shows organizations that lead on data use in decisions are far more likely to acquire customers, retain them, and stay profitable than peers who rely mainly on intuition.
3. What’s the difference between intuition and data-driven decisions?
Intuition draws on personal experience and pattern recognition built over time. Data-driven decisions draw on verified, traceable evidence. The strongest decisions usually combine both, using data to test what intuition suggests.
4. How do you implement data-driven decision making?
Start with the six-step framework covered above: define your objectives, locate your data sources, collect and clean the data, analyze it, visualize the findings, and build a culture that acts on the results.
5. What tools do you need for data-driven decisions?
At minimum, a way to integrate data across systems, a way to analyze it (from simple BI tools to machine learning models), and a way to visualize findings for the people making decisions.
6. How does AI automate decision-making?
AI models analyze data faster than manual review allows, then generate recommendations or, for lower-risk and well-defined decisions, take the action directly.
7. What’s data governance and why does it matter?
Data governance is the set of policies that define how data is collected, stored, secured, and who owns its accuracy. Without it, data quality degrades quietly until decisions built on it start failing.
8. How long does it take to build a data-driven culture?
There is no fixed timeline, but most organizations see meaningful shifts within 12 to 18 months of consistent training, clear expectations, and leadership visibly using data in their own decisions.
9. What’s ROI on data-driven strategy investment?
It varies by industry and starting point, but the clearest signal is avoided cost. Given that Gartner estimates poor data quality alone costs organizations an average of $12.9 million a year, closing that gap is often where the fastest returns show up.
10. How do you measure the success of DDDM adoption?
Track decision-making KPIs directly, including time to decision and decision reversal rate, alongside the operational, customer, and financial KPIs the decisions were meant to improve.